import numpy as np
import scipy.stats as spst
import pandas as pd
import matplotlib.pyplot as plt
import seaborn as sns
import statsmodels.api as sm
import statsmodels.formula.api as smf
import duckdb
import plotly.express as px
import warnings<h1> Statistical Analysis of Yelp Dataset to Understand Restaurant Performance
</h1>
Akash Singha - FT251009|
Aditya Gulati - FT251007|
Rohit Chowdhury - FT251065|
Pragati Sharma - FT251053|
Subhashish Mohan Kar - FT251092|
<br>
Section 1 | Group - 18<h3>Setup of DataBase
</h3>con = duckdb.connect("yelp.db") ##connecting to the yelp databasewarnings.filterwarnings("ignore")Importing the excel files into different SQL tables
con.sql("""
    CREATE TABLE IF NOT EXISTS restos AS
    FROM read_csv('yelp.restaurants_train.csv', sample_size = -1);
""")

con.sql("""
    CREATE TABLE IF NOT EXISTS resto_reviews AS
    FROM read_csv('yelp.restaurant_reviews.csv', sample_size = -1);
""")

con.sql("""
    CREATE TABLE IF NOT EXISTS users AS
    FROM read_csv('yelp.user.csv', sample_size = -1);
""")

con.sql("""
    CREATE TABLE IF NOT EXISTS user_friends AS
    FROM read_csv('yelp.user_friends_full.csv', sample_size = -1);
""")

con.sql("""
    CREATE TABLE IF NOT EXISTS resto_test AS
    FROM read_csv('yelp.restaurants_test.csv', sample_size = -1);
""")
<h2>Exploring the tables and their datatypes:
</h2>Restaurants_train table
result = con.execute("SELECT COUNT(*) FROM restos").fetchone()
row_count = result[0]
row_count48800con.sql("""
SELECT * FROM restos
LIMIT 5;
""")┌──────────────────────┬─────────────────────┬───────────┬───┬──────────────────────┬──────────────────────┐
│ name │ address │ city │ … │ attributes.Accepts… │ attributes.HairSpe… │
│ varchar │ varchar │ varchar │ │ boolean │ varchar │
├──────────────────────┼─────────────────────┼───────────┼───┼──────────────────────┼──────────────────────┤
│ Oskar Blues Taproom │ 921 Pearl St │ Boulder │ … │ NULL │ NULL │
│ Flying Elephants a… │ 7000 NE Airport Way │ Portland │ … │ NULL │ NULL │
│ Bob Likes Thai Food │ 3755 Main St │ Vancouver │ … │ NULL │ NULL │
│ Boxwood Biscuit │ 740 S High St │ Columbus │ … │ NULL │ NULL │
│ Mr G's Pizza & Subs │ 474 Lowell St │ Peabody │ … │ NULL │ NULL │
├──────────────────────┴─────────────────────┴───────────┴───┴──────────────────────┴──────────────────────┤
│ 5 rows 60 columns (5 shown) │
└──────────────────────────────────────────────────────────────────────────────────────────────────────────┘Converting the table to a dataframe:
df_restos = con.sql("""
    SELECT * FROM restos
    LIMIT 5;
""").df()
df_restos| name | address | city | state | postal_code | latitude | longitude | stars | review_count | is_open | ... | attributes.Smoking | attributes.DriveThru | attributes.BYOBCorkage | attributes.Corkage | attributes.RestaurantsCounterService | attributes.DietaryRestrictions | attributes.AgesAllowed | attributes.Open24Hours | attributes.AcceptsInsurance | attributes.HairSpecializesIn | |
|---|---|---|---|---|---|---|---|---|---|---|---|---|---|---|---|---|---|---|---|---|---|
| 0 | Oskar Blues Taproom | 921 Pearl St | Boulder | CO | 80302 | 40.017544 | -105.283348 | 4.0 | 86 | 1 | ... | None | None | None | None | NaN | None | None | NaN | NaN | None |
| 1 | Flying Elephants at PDX | 7000 NE Airport Way | Portland | OR | 97218 | 45.588906 | -122.593331 | 4.0 | 126 | 1 | ... | None | None | None | None | NaN | None | None | NaN | NaN | None |
| 2 | Bob Likes Thai Food | 3755 Main St | Vancouver | BC | V5V | 49.251342 | -123.101333 | 3.5 | 169 | 1 | ... | None | None | None | None | NaN | None | None | NaN | NaN | None |
| 3 | Boxwood Biscuit | 740 S High St | Columbus | OH | 43206 | 39.947007 | -82.997471 | 4.5 | 11 | 1 | ... | None | None | None | None | NaN | None | None | NaN | NaN | None |
| 4 | Mr G's Pizza & Subs | 474 Lowell St | Peabody | MA | 01960 | 42.541155 | -70.973438 | 4.0 | 39 | 1 | ... | None | None | None | None | NaN | None | None | NaN | NaN | None |
5 rows × 60 columns
Details for all the columns:
con.sql("""
    DESCRIBE restos
""").df()| column_name | column_type | null | key | default | extra | |
|---|---|---|---|---|---|---|
| 0 | name | VARCHAR | YES | None | None | None |
| 1 | address | VARCHAR | YES | None | None | None |
| 2 | city | VARCHAR | YES | None | None | None |
| 3 | state | VARCHAR | YES | None | None | None |
| 4 | postal_code | VARCHAR | YES | None | None | None |
| 5 | latitude | DOUBLE | YES | None | None | None |
| 6 | longitude | DOUBLE | YES | None | None | None |
| 7 | stars | DOUBLE | YES | None | None | None |
| 8 | review_count | BIGINT | YES | None | None | None |
| 9 | is_open | BIGINT | YES | None | None | None |
| 10 | attributes.RestaurantsTableService | VARCHAR | YES | None | None | None |
| 11 | attributes.WiFi | VARCHAR | YES | None | None | None |
| 12 | attributes.BikeParking | VARCHAR | YES | None | None | None |
| 13 | attributes.BusinessParking | VARCHAR | YES | None | None | None |
| 14 | attributes.BusinessAcceptsCreditCards | VARCHAR | YES | None | None | None |
| 15 | attributes.RestaurantsReservations | VARCHAR | YES | None | None | None |
| 16 | attributes.WheelchairAccessible | VARCHAR | YES | None | None | None |
| 17 | attributes.Caters | VARCHAR | YES | None | None | None |
| 18 | attributes.OutdoorSeating | VARCHAR | YES | None | None | None |
| 19 | attributes.RestaurantsGoodForGroups | VARCHAR | YES | None | None | None |
| 20 | attributes.HappyHour | VARCHAR | YES | None | None | None |
| 21 | attributes.BusinessAcceptsBitcoin | BOOLEAN | YES | None | None | None |
| 22 | attributes.RestaurantsPriceRange2 | VARCHAR | YES | None | None | None |
| 23 | attributes.Ambience | VARCHAR | YES | None | None | None |
| 24 | attributes.HasTV | VARCHAR | YES | None | None | None |
| 25 | attributes.Alcohol | VARCHAR | YES | None | None | None |
| 26 | attributes.GoodForMeal | VARCHAR | YES | None | None | None |
| 27 | attributes.DogsAllowed | VARCHAR | YES | None | None | None |
| 28 | attributes.RestaurantsTakeOut | VARCHAR | YES | None | None | None |
| 29 | attributes.NoiseLevel | VARCHAR | YES | None | None | None |
| 30 | attributes.RestaurantsAttire | VARCHAR | YES | None | None | None |
| 31 | attributes.RestaurantsDelivery | VARCHAR | YES | None | None | None |
| 32 | categories | VARCHAR | YES | None | None | None |
| 33 | hours.Monday | VARCHAR | YES | None | None | None |
| 34 | hours.Tuesday | VARCHAR | YES | None | None | None |
| 35 | hours.Wednesday | VARCHAR | YES | None | None | None |
| 36 | hours.Thursday | VARCHAR | YES | None | None | None |
| 37 | hours.Friday | VARCHAR | YES | None | None | None |
| 38 | hours.Saturday | VARCHAR | YES | None | None | None |
| 39 | hours.Sunday | VARCHAR | YES | None | None | None |
| 40 | int_business_id | BIGINT | YES | None | None | None |
| 41 | attributes.GoodForKids | VARCHAR | YES | None | None | None |
| 42 | attributes.ByAppointmentOnly | BOOLEAN | YES | None | None | None |
| 43 | attributes | VARCHAR | YES | None | None | None |
| 44 | hours | VARCHAR | YES | None | None | None |
| 45 | attributes.Music | VARCHAR | YES | None | None | None |
| 46 | attributes.GoodForDancing | VARCHAR | YES | None | None | None |
| 47 | attributes.BestNights | VARCHAR | YES | None | None | None |
| 48 | attributes.BYOB | VARCHAR | YES | None | None | None |
| 49 | attributes.CoatCheck | VARCHAR | YES | None | None | None |
| 50 | attributes.Smoking | VARCHAR | YES | None | None | None |
| 51 | attributes.DriveThru | VARCHAR | YES | None | None | None |
| 52 | attributes.BYOBCorkage | VARCHAR | YES | None | None | None |
| 53 | attributes.Corkage | VARCHAR | YES | None | None | None |
| 54 | attributes.RestaurantsCounterService | BOOLEAN | YES | None | None | None |
| 55 | attributes.DietaryRestrictions | VARCHAR | YES | None | None | None |
| 56 | attributes.AgesAllowed | VARCHAR | YES | None | None | None |
| 57 | attributes.Open24Hours | BOOLEAN | YES | None | None | None |
| 58 | attributes.AcceptsInsurance | BOOLEAN | YES | None | None | None |
| 59 | attributes.HairSpecializesIn | VARCHAR | YES | None | None | None |
con.sql("""
    DESCRIBE restos
""")
┌──────────────────────────────────────┬─────────────┬─────────┬─────────┬─────────┬─────────┐
│ column_name │ column_type │ null │ key │ default │ extra │
│ varchar │ varchar │ varchar │ varchar │ varchar │ varchar │
├──────────────────────────────────────┼─────────────┼─────────┼─────────┼─────────┼─────────┤
│ name │ VARCHAR │ YES │ NULL │ NULL │ NULL │
│ address │ VARCHAR │ YES │ NULL │ NULL │ NULL │
│ city │ VARCHAR │ YES │ NULL │ NULL │ NULL │
│ state │ VARCHAR │ YES │ NULL │ NULL │ NULL │
│ postal_code │ VARCHAR │ YES │ NULL │ NULL │ NULL │
│ latitude │ DOUBLE │ YES │ NULL │ NULL │ NULL │
│ longitude │ DOUBLE │ YES │ NULL │ NULL │ NULL │
│ stars │ DOUBLE │ YES │ NULL │ NULL │ NULL │
│ review_count │ BIGINT │ YES │ NULL │ NULL │ NULL │
│ is_open │ BIGINT │ YES │ NULL │ NULL │ NULL │
│ · │ · │ · │ · │ · │ · │
│ · │ · │ · │ · │ · │ · │
│ · │ · │ · │ · │ · │ · │
│ attributes.Smoking │ VARCHAR │ YES │ NULL │ NULL │ NULL │
│ attributes.DriveThru │ VARCHAR │ YES │ NULL │ NULL │ NULL │
│ attributes.BYOBCorkage │ VARCHAR │ YES │ NULL │ NULL │ NULL │
│ attributes.Corkage │ VARCHAR │ YES │ NULL │ NULL │ NULL │
│ attributes.RestaurantsCounterService │ BOOLEAN │ YES │ NULL │ NULL │ NULL │
│ attributes.DietaryRestrictions │ VARCHAR │ YES │ NULL │ NULL │ NULL │
│ attributes.AgesAllowed │ VARCHAR │ YES │ NULL │ NULL │ NULL │
│ attributes.Open24Hours │ BOOLEAN │ YES │ NULL │ NULL │ NULL │
│ attributes.AcceptsInsurance │ BOOLEAN │ YES │ NULL │ NULL │ NULL │
│ attributes.HairSpecializesIn │ VARCHAR │ YES │ NULL │ NULL │ NULL │
├──────────────────────────────────────┴─────────────┴─────────┴─────────┴─────────┴─────────┤
│ 60 rows (20 shown) 6 columns │
└────────────────────────────────────────────────────────────────────────────────────────────┘Restaurant Reviews Table:
con.sql("""
    DESCRIBE resto_reviews
""").df()| column_name | column_type | null | key | default | extra | |
|---|---|---|---|---|---|---|
| 0 | stars | BIGINT | YES | None | None | None |
| 1 | useful | BIGINT | YES | None | None | None |
| 2 | funny | BIGINT | YES | None | None | None |
| 3 | cool | BIGINT | YES | None | None | None |
| 4 | text | VARCHAR | YES | None | None | None |
| 5 | date | TIMESTAMP | YES | None | None | None |
| 6 | int_business_id | BIGINT | YES | None | None | None |
| 7 | int_user_id | BIGINT | YES | None | None | None |
| 8 | int_rest_review_id | BIGINT | YES | None | None | None |
df_restos_reviews = con.sql("""
    SELECT * FROM resto_reviews
    LIMIT 5;
""").df()
df_restos_reviews| stars | useful | funny | cool | text | date | int_business_id | int_user_id | int_rest_review_id | |
|---|---|---|---|---|---|---|---|---|---|
| 0 | 2 | 1 | 1 | 1 | I've stayed at many Marriott and Renaissance M... | 2010-01-08 02:29:15 | 4954 | 6319642 | 2 |
| 1 | 2 | 0 | 0 | 0 | The setting is perfectly adequate, and the foo... | 2006-04-16 02:58:44 | 14180 | 292901 | 5 |
| 2 | 5 | 0 | 0 | 0 | I work in the Pru and this is the most afforda... | 2014-05-07 18:10:21 | 11779 | 6336225 | 7 |
| 3 | 5 | 5 | 3 | 3 | I loved everything about this place. I've only... | 2014-02-05 21:09:05 | 3216 | 552519 | 12 |
| 4 | 4 | 0 | 0 | 0 | I think their rice dishes are way better than ... | 2017-05-26 03:05:46 | 8748 | 544027 | 16 |
df_restos_reviews = con.sql("""
    SELECT * FROM resto_reviews
    LIMIT 5;
""")
df_restos_reviews
┌───────┬────────┬───────┬───────┬───┬─────────────────────┬─────────────────┬─────────────┬────────────────────┐
│ stars │ useful │ funny │ cool │ … │ date │ int_business_id │ int_user_id │ int_rest_review_id │
│ int64 │ int64 │ int64 │ int64 │ │ timestamp │ int64 │ int64 │ int64 │
├───────┼────────┼───────┼───────┼───┼─────────────────────┼─────────────────┼─────────────┼────────────────────┤
│ 2 │ 1 │ 1 │ 1 │ … │ 2010-01-08 02:29:15 │ 4954 │ 6319642 │ 2 │
│ 2 │ 0 │ 0 │ 0 │ … │ 2006-04-16 02:58:44 │ 14180 │ 292901 │ 5 │
│ 5 │ 0 │ 0 │ 0 │ … │ 2014-05-07 18:10:21 │ 11779 │ 6336225 │ 7 │
│ 5 │ 5 │ 3 │ 3 │ … │ 2014-02-05 21:09:05 │ 3216 │ 552519 │ 12 │
│ 4 │ 0 │ 0 │ 0 │ … │ 2017-05-26 03:05:46 │ 8748 │ 544027 │ 16 │
├───────┴────────┴───────┴───────┴───┴─────────────────────┴─────────────────┴─────────────┴────────────────────┤
│ 5 rows 9 columns (8 shown) │
└───────────────────────────────────────────────────────────────────────────────────────────────────────────────┘result = con.execute("SELECT COUNT(*) FROM resto_reviews").fetchone()
row_count = result[0]
row_count1674096Users Table
result = con.execute("SELECT COUNT(*) FROM users").fetchone()
row_count = result[0]
row_count2189457df_restos_users = con.sql("""
SELECT * FROM users
LIMIT 5;
""").df()
df_restos_users.to_excel('tw2o.xlsx')con.sql("""
DESCRIBE users
""").df()| column_name | column_type | null | key | default | extra | |
|---|---|---|---|---|---|---|
| 0 | review_count | BIGINT | YES | None | None | None |
| 1 | yelping_since | TIMESTAMP | YES | None | None | None |
| 2 | useful | BIGINT | YES | None | None | None |
| 3 | funny | BIGINT | YES | None | None | None |
| 4 | cool | BIGINT | YES | None | None | None |
| 5 | elite | VARCHAR | YES | None | None | None |
| 6 | fans | BIGINT | YES | None | None | None |
| 7 | average_stars | DOUBLE | YES | None | None | None |
| 8 | compliment_hot | BIGINT | YES | None | None | None |
| 9 | compliment_more | BIGINT | YES | None | None | None |
| 10 | compliment_profile | BIGINT | YES | None | None | None |
| 11 | compliment_cute | BIGINT | YES | None | None | None |
| 12 | compliment_list | BIGINT | YES | None | None | None |
| 13 | compliment_note | BIGINT | YES | None | None | None |
| 14 | compliment_plain | BIGINT | YES | None | None | None |
| 15 | compliment_cool | BIGINT | YES | None | None | None |
| 16 | compliment_funny | BIGINT | YES | None | None | None |
| 17 | compliment_writer | BIGINT | YES | None | None | None |
| 18 | compliment_photos | BIGINT | YES | None | None | None |
| 19 | int_user_id | BIGINT | YES | None | None | None |
user_friends tables:
con.sql("""
    DESCRIBE user_friends
""").df()| column_name | column_type | null | key | default | extra | |
|---|---|---|---|---|---|---|
| 0 | int_user_id | BIGINT | YES | None | None | None |
| 1 | num_friends | BIGINT | YES | None | None | None |
df_restos_user_friends = con.sql("""
    SELECT * FROM user_friends
    LIMIT 5;
""").df()
df_restos_user_friends| int_user_id | num_friends | |
|---|---|---|
| 0 | 1 | 5813 |
| 1 | 1248 | 6296 |
| 2 | 11604 | 835 |
| 3 | 2278 | 1452 |
| 4 | 13481 | 532 |
result = con.execute("SELECT COUNT(*) FROM user_friends").fetchone()
row_count = result[0]
row_count2189457restaurants_test table:
result = con.execute("SELECT COUNT(*) FROM resto_test").fetchone()
row_count = result[0]
row_count1963df_resto_test = con.sql("""
SELECT * FROM resto_test
LIMIT 5;
""").df()
df_resto_test| stars | name | address | city | state | postal_code | latitude | longitude | review_count | is_open | ... | attributes.Smoking | attributes.DriveThru | attributes.BYOBCorkage | attributes.Corkage | attributes.RestaurantsCounterService | attributes.DietaryRestrictions | attributes.AgesAllowed | attributes.Open24Hours | attributes.AcceptsInsurance | attributes.HairSpecializesIn | |
|---|---|---|---|---|---|---|---|---|---|---|---|---|---|---|---|---|---|---|---|---|---|
| 0 | None | 1st Avenue Seafood by Pocha | 901 Lougheed Hwy | Coquitlam | BC | V3K 3T3 | 49.237547 | -122.872628 | 12 | 0 | ... | None | None | None | None | None | None | None | None | None | None |
| 1 | None | Papi's Cuban & Caribbean Grill | 216 Ponce De Leon Ave NE | Atlanta | GA | 30308 | 33.772758 | -84.380375 | 1001 | 1 | ... | None | None | 'yes_free' | FALSE | None | None | None | None | None | None |
| 2 | None | D'angelo Sandwich Shop | 1277 Broadway | Saugus | MA | 01906 | 42.461100 | -71.026910 | 6 | 1 | ... | None | None | None | None | None | None | None | None | None | None |
| 3 | None | Mandarin House | 6263 Roswell Rd NE | Atlanta | GA | 30328 | 33.925975 | -84.378159 | 22 | 0 | ... | None | None | None | None | None | None | None | None | None | None |
| 4 | None | Jr Crickets | 1197 Peachtree St NE | Atlanta | GA | 30361 | 33.786873 | -84.382572 | 25 | 0 | ... | None | None | None | None | None | None | None | None | None | None |
5 rows × 60 columns
con.sql("""
    DESCRIBE resto_test
""").df()| column_name | column_type | null | key | default | extra | |
|---|---|---|---|---|---|---|
| 0 | stars | VARCHAR | YES | None | None | None |
| 1 | name | VARCHAR | YES | None | None | None |
| 2 | address | VARCHAR | YES | None | None | None |
| 3 | city | VARCHAR | YES | None | None | None |
| 4 | state | VARCHAR | YES | None | None | None |
| 5 | postal_code | VARCHAR | YES | None | None | None |
| 6 | latitude | DOUBLE | YES | None | None | None |
| 7 | longitude | DOUBLE | YES | None | None | None |
| 8 | review_count | BIGINT | YES | None | None | None |
| 9 | is_open | BIGINT | YES | None | None | None |
| 10 | attributes.RestaurantsTableService | VARCHAR | YES | None | None | None |
| 11 | attributes.WiFi | VARCHAR | YES | None | None | None |
| 12 | attributes.BikeParking | BOOLEAN | YES | None | None | None |
| 13 | attributes.BusinessParking | VARCHAR | YES | None | None | None |
| 14 | attributes.BusinessAcceptsCreditCards | VARCHAR | YES | None | None | None |
| 15 | attributes.RestaurantsReservations | VARCHAR | YES | None | None | None |
| 16 | attributes.WheelchairAccessible | BOOLEAN | YES | None | None | None |
| 17 | attributes.Caters | VARCHAR | YES | None | None | None |
| 18 | attributes.OutdoorSeating | VARCHAR | YES | None | None | None |
| 19 | attributes.RestaurantsGoodForGroups | BOOLEAN | YES | None | None | None |
| 20 | attributes.HappyHour | BOOLEAN | YES | None | None | None |
| 21 | attributes.BusinessAcceptsBitcoin | BOOLEAN | YES | None | None | None |
| 22 | attributes.RestaurantsPriceRange2 | VARCHAR | YES | None | None | None |
| 23 | attributes.Ambience | VARCHAR | YES | None | None | None |
| 24 | attributes.HasTV | VARCHAR | YES | None | None | None |
| 25 | attributes.Alcohol | VARCHAR | YES | None | None | None |
| 26 | attributes.GoodForMeal | VARCHAR | YES | None | None | None |
| 27 | attributes.DogsAllowed | BOOLEAN | YES | None | None | None |
| 28 | attributes.RestaurantsTakeOut | VARCHAR | YES | None | None | None |
| 29 | attributes.NoiseLevel | VARCHAR | YES | None | None | None |
| 30 | attributes.RestaurantsAttire | VARCHAR | YES | None | None | None |
| 31 | attributes.RestaurantsDelivery | VARCHAR | YES | None | None | None |
| 32 | categories | VARCHAR | YES | None | None | None |
| 33 | hours.Monday | VARCHAR | YES | None | None | None |
| 34 | hours.Tuesday | VARCHAR | YES | None | None | None |
| 35 | hours.Wednesday | VARCHAR | YES | None | None | None |
| 36 | hours.Thursday | VARCHAR | YES | None | None | None |
| 37 | hours.Friday | VARCHAR | YES | None | None | None |
| 38 | hours.Saturday | VARCHAR | YES | None | None | None |
| 39 | hours.Sunday | VARCHAR | YES | None | None | None |
| 40 | int_business_id | BIGINT | YES | None | None | None |
| 41 | attributes.GoodForKids | VARCHAR | YES | None | None | None |
| 42 | attributes.ByAppointmentOnly | BOOLEAN | YES | None | None | None |
| 43 | attributes | VARCHAR | YES | None | None | None |
| 44 | hours | VARCHAR | YES | None | None | None |
| 45 | attributes.Music | VARCHAR | YES | None | None | None |
| 46 | attributes.GoodForDancing | VARCHAR | YES | None | None | None |
| 47 | attributes.BestNights | VARCHAR | YES | None | None | None |
| 48 | attributes.BYOB | BOOLEAN | YES | None | None | None |
| 49 | attributes.CoatCheck | BOOLEAN | YES | None | None | None |
| 50 | attributes.Smoking | VARCHAR | YES | None | None | None |
| 51 | attributes.DriveThru | VARCHAR | YES | None | None | None |
| 52 | attributes.BYOBCorkage | VARCHAR | YES | None | None | None |
| 53 | attributes.Corkage | VARCHAR | YES | None | None | None |
| 54 | attributes.RestaurantsCounterService | VARCHAR | YES | None | None | None |
| 55 | attributes.DietaryRestrictions | VARCHAR | YES | None | None | None |
| 56 | attributes.AgesAllowed | VARCHAR | YES | None | None | None |
| 57 | attributes.Open24Hours | VARCHAR | YES | None | None | None |
| 58 | attributes.AcceptsInsurance | VARCHAR | YES | None | None | None |
| 59 | attributes.HairSpecializesIn | VARCHAR | YES | None | None | None |
Descriptive Analysis
Average stars given to the restaurents
con.sql("""
    SELECT avg(stars) FROM restos
""")
┌───────────────────┐
│ avg(stars) │
│ double │
├───────────────────┤
│ 3.527858606557377 │
└───────────────────┘df_temp = con.sql("""
SELECT stars FROM restos
""").df()
df_temp| stars | |
|---|---|
| 0 | 4.0 |
| 1 | 4.0 |
| 2 | 3.5 |
| 3 | 4.5 |
| 4 | 4.0 |
| ... | ... |
| 48795 | 2.0 |
| 48796 | 3.0 |
| 48797 | 3.0 |
| 48798 | 4.0 |
| 48799 | 4.5 |
48800 rows × 1 columns
descriptive statistics of stars column
df_temp.describe()| stars | |
|---|---|
| count | 48800.000000 |
| mean | 3.527859 |
| std | 0.773849 |
| min | 1.000000 |
| 25% | 3.000000 |
| 50% | 3.500000 |
| 75% | 4.000000 |
| max | 5.000000 |
df_temp.isnull().sum().sum() ## if there are null values present or not in the column.0histplot of the star column
sns.displot(data = df_temp, x = "stars", kind = "hist")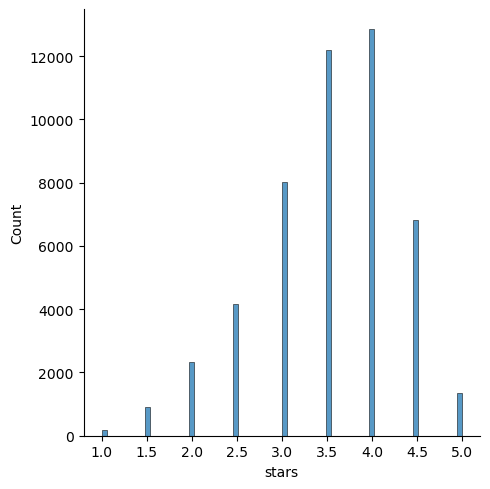
average stars on yelp recieved by restaurant grouped by states
df_temp = con.sql("""
    SELECT state, avg(stars) as avg_stars FROM restos
    GROUP BY state
    ORDER BY avg_stars DESC
""").df()
df_temp| state | avg_stars | |
|---|---|---|
| 0 | ABE | 4.500000 |
| 1 | NH | 4.000000 |
| 2 | OR | 3.752074 |
| 3 | TX | 3.656262 |
| 4 | CO | 3.587216 |
| 5 | FL | 3.521030 |
| 6 | MN | 3.500000 |
| 7 | MA | 3.480819 |
| 8 | BC | 3.454463 |
| 9 | WA | 3.450202 |
| 10 | OH | 3.421853 |
| 11 | GA | 3.399796 |
| 12 | VA | 2.000000 |
| 13 | KY | 2.000000 |
| 14 | KS | 2.000000 |
| 15 | WY | 1.500000 |
df=df_temp
plt.figure(figsize=(12, 8))
plt.bar(df['state'], df['avg_stars'], color='orange')
plt.xlabel('State')
plt.ylabel('Average Stars')
plt.title('Average Star Ratings by State')
plt.xticks(rotation=45)  # Rotate state labels for better readability
plt.ylim(0, 5)  # Set y-axis limit to make the plot more readable
plt.show()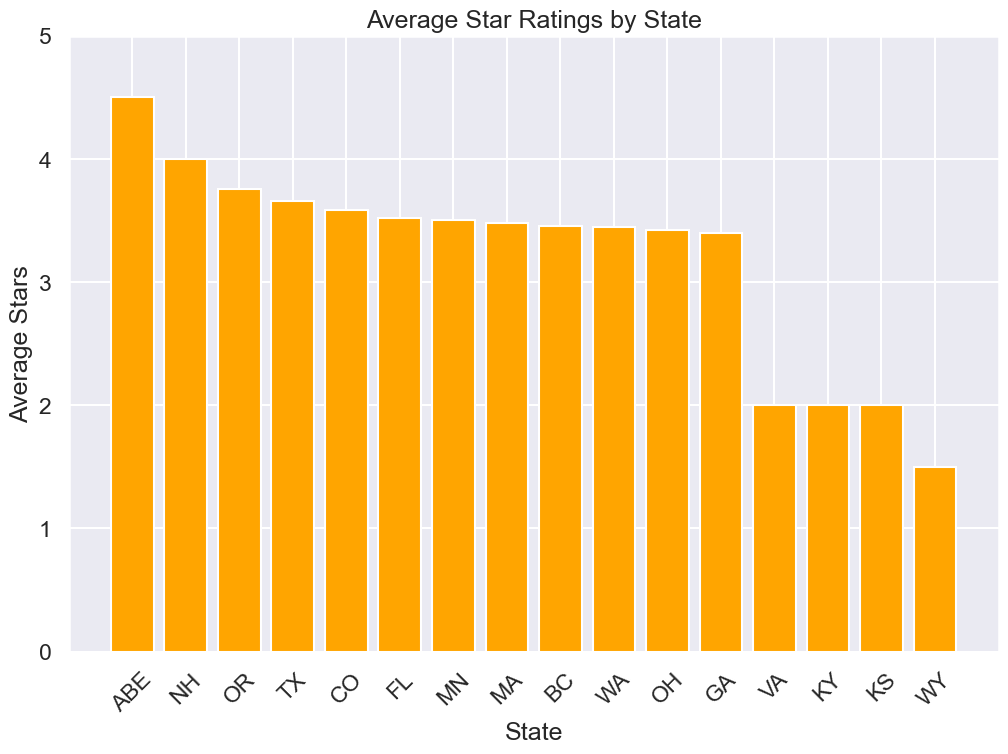
So from this observation we can get a understanding that where high quality restaurants are more in number and where it is rare
.
df1 = con.sql("""SELECT
    r.city,
    COUNT(rv.int_rest_review_id) AS review_count
FROM
    restos r
JOIN
    resto_reviews rv
ON
    r.int_business_id = rv.int_business_id
GROUP BY
    r.city""").df()
df1| city | review_count | |
|---|---|---|
| 0 | East Boston | 655 |
| 1 | Cocoa | 1483 |
| 2 | Wellesley | 1857 |
| 3 | Beverly | 3061 |
| 4 | Norcross | 425 |
| ... | ... | ... |
| 443 | east boston | 8 |
| 444 | Griffin | 6 |
| 445 | DAVENPORT | 15 |
| 446 | Lake Buena Visa | 13 |
| 447 | Orlanto | 5 |
448 rows × 2 columns
from geopy.geocoders import Nominatim
geolocator = Nominatim(user_agent="city_mapper")
def geocode(city):
    try:
        location = geolocator.geocode(city)
        return location.latitude, location.longitude
    except:
        return None, None

df1['latitude'], df1['longitude'] = zip(*df1['city'].apply(geocode))
import geopandas as gpd
import matplotlib.pyplot as plt
df1 = df1.dropna(subset=['latitude', 'longitude'])
# Load a map of the world
world = gpd.read_file("C:/Users/akash/Code/project-20240826T060102Z-001/project/ne_110m_admin_0_countries/ne_110m_admin_0_countries.shp")
# Plot the world map
# Plot the world map
fig, ax = plt.subplots(figsize=(15, 10))
world.boundary.plot(ax=ax, linewidth=1, color='black') # Plot national borders
world = gpd.read_file("C:/Users/akash/Code/project-20240826T060102Z-001/project/ne_110m_admin_0_countries/ne_110m_populated_places.shp")
# Adjust marker sizes and transparency
scaling_factor = 0.005 # Reduce this factor to make the circles smaller
gdf.plot(ax=ax, color='red', markersize=gdf['review_count'] * scaling_factor, alpha=0.5)
top_10 = gdf.nlargest(10, 'review_count')
# Add labels for only the top 10 places
for x, y, label in zip(top_20.geometry.x, top_20.geometry.y, top_20['city']):
ax.text(x, y, s=label, fontsize=6, ha='center', va='center', color='black', alpha=1)
plt.show()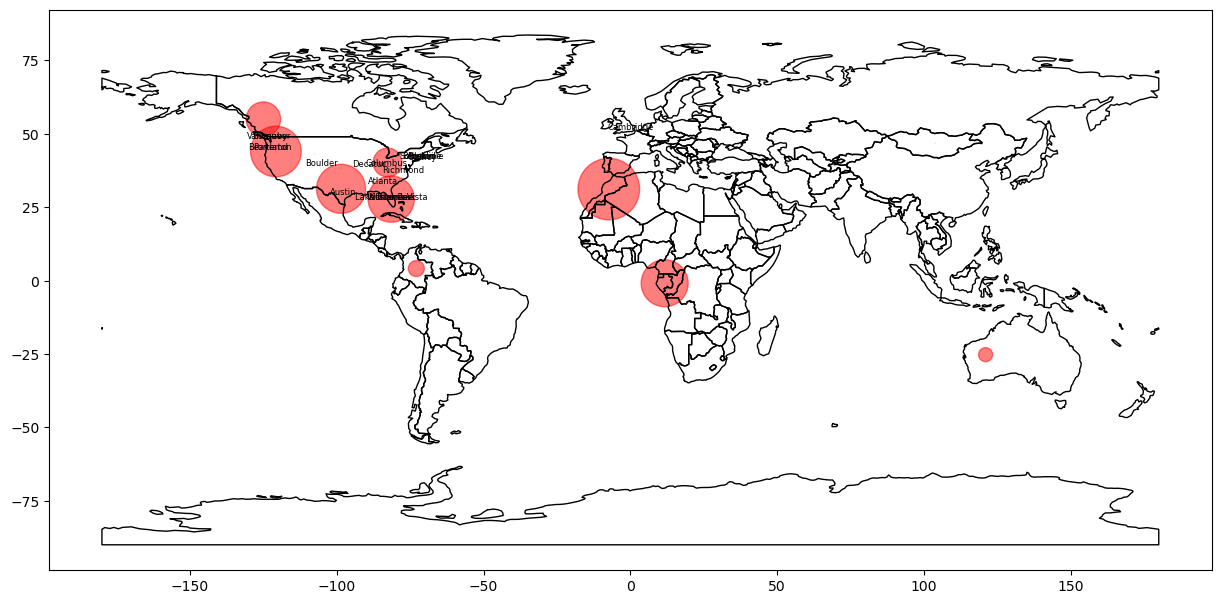
df2 = con.sql("""SELECT
    r.state,
    COUNT(rv.int_rest_review_id) AS review_count
FROM
    restos r
JOIN
    resto_reviews rv
ON
    r.int_business_id = rv.int_business_id
GROUP BY
    r.state""").df()
df2| state | review_count | |
|---|---|---|
| 0 | OH | 86476 |
| 1 | OR | 266231 |
| 2 | VA | 2 |
| 3 | CO | 26556 |
| 4 | BC | 122825 |
| 5 | WY | 1 |
| 6 | MN | 2 |
| 7 | KS | 4 |
| 8 | FL | 221779 |
| 9 | TX | 249741 |
| 10 | MA | 393942 |
| 11 | GA | 229046 |
| 12 | WA | 20484 |
| 13 | NH | 4 |
| 14 | KY | 1 |
| 15 | ABE | 3 |
from geopy.geocoders import Nominatim
geolocator = Nominatim(user_agent="state_mapper")
def geocode(state):
    try:
        location = geolocator.geocode(state)
        return location.latitude, location.longitude
    except:
        return None, None

df2['latitude'], df2['longitude'] = zip(*df2['state'].apply(geocode))
df2| state | review_count | latitude | longitude | |
|---|---|---|---|---|
| 0 | OH | 86476 | 40.225357 | -82.688140 |
| 1 | OR | 266231 | 43.979280 | -120.737257 |
| 2 | VA | 2 | 41.903411 | 12.452853 |
| 3 | CO | 26556 | 4.099917 | -72.908813 |
| 4 | BC | 122825 | 55.001251 | -125.002441 |
| 5 | WY | 1 | 43.170026 | -107.568534 |
| 6 | MN | 2 | 46.825039 | 103.849974 |
| 7 | KS | 4 | 38.273120 | -98.582187 |
| 8 | FL | 221779 | 27.756767 | -81.463983 |
| 9 | TX | 249741 | 31.263890 | -98.545612 |
| 10 | MA | 393942 | 31.172821 | -7.336248 |
| 11 | GA | 229046 | -0.899969 | 11.689970 |
| 12 | WA | 20484 | -25.230300 | 121.018725 |
| 13 | NH | 4 | 52.721283 | 4.820665 |
| 14 | KY | 1 | 19.703182 | -79.917463 |
| 15 | ABE | 3 | 48.891946 | 2.245066 |
import geopandas as gpd
import matplotlib.pyplot as plt

df2 = df2.dropna(subset=['latitude', 'longitude'])
gdf = gpd.GeoDataFrame(df2, geometry=gpd.points_from_xy(df2.longitude, df2.latitude))
# Load a map of the world
world = gpd.read_file("C:/Users/akash/Code/project-20240826T060102Z-001/project/ne_110m_admin_0_countries/ne_110m_admin_0_countries.shp")

# Plot the world map
# Plot the world map
fig, ax = plt.subplots(figsize=(15, 10))
world.boundary.plot(ax=ax, linewidth=1, color='black')  # Plot national borders
world = gpd.read_file("C:/Users/akash/Code/project-20240826T060102Z-001/project/ne_110m_admin_0_countries/ne_110m_admin_1_states_provinces_lines.shp")

# Adjust marker sizes and transparency
scaling_factor = 0.005 # Reduce this factor to make the circles smaller
gdf.plot(ax=ax, color='red', markersize=gdf['review_count'] * scaling_factor, alpha=0.5)


for x, y, label in zip(gdf.geometry.x, gdf.geometry.y, gdf['state']):
    ax.text(x, y, s=label, fontsize=8, ha='center', va='center', color='black', alpha=0.7)

plt.show()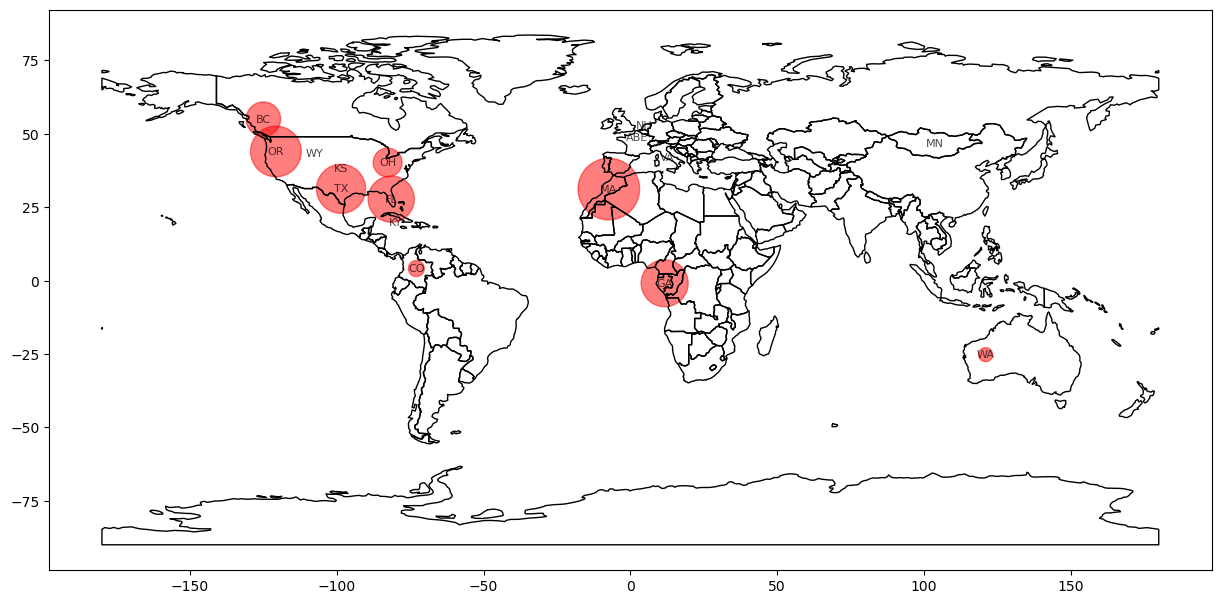
<h1>Focussing on USA states as majority are from USA
    </h1>
df_temp = con.sql("""
SELECT state, avg(stars) as Mean_stars FROM restos
GROUP BY state
""").df()fig = px.choropleth(df_temp,
locations=df_temp["state"],
locationmode="USA-states",
scope="usa",
color=df_temp["Mean_stars"],
color_continuous_scale="greens",
)
fig.show()By going through these plots and reviews we can understand the places where avg stars are low and where more people are giving reviews. So we can open a good restaurant where the avg stars are low but the number of reviews are high like in BC or OH or GA. As it shows that there the people are more so demand is high and not so many good quality restaurants are there
<h1>Descriptive Analysis
</h1></div>con.sql("""
SELECT state, avg(stars) as Mean_stars, median(stars) as Median_stars, mode(stars) as Mode_stars, stddev_samp(stars) as Standard_deviation FROM restos
GROUP BY state
ORDER BY Mean_stars DESC
""")┌─────────┬────────────────────┬──────────────┬────────────┬────────────────────┐
│ state │ Mean_stars │ Median_stars │ Mode_stars │ Standard_deviation │
│ varchar │ double │ double │ double │ double │
├─────────┼────────────────────┼──────────────┼────────────┼────────────────────┤
│ ABE │ 4.5 │ 4.5 │ 4.5 │ NULL │
│ NH │ 4.0 │ 4.0 │ 4.0 │ NULL │
│ OR │ 3.7520742511601743 │ 4.0 │ 4.0 │ 0.7493932759028515 │
│ TX │ 3.6562618956985156 │ 4.0 │ 4.0 │ 0.7900977902196283 │
│ CO │ 3.587216248506571 │ 3.5 │ 4.0 │ 0.7164616119919883 │
│ FL │ 3.5210299272040984 │ 3.5 │ 4.0 │ 0.8193855357786395 │
│ MN │ 3.5 │ 3.5 │ 3.5 │ NULL │
│ MA │ 3.480818540433925 │ 3.5 │ 3.5 │ 0.7230047660400158 │
│ BC │ 3.454463292547275 │ 3.5 │ 3.5 │ 0.6927356872193546 │
│ WA │ 3.4502018842530284 │ 3.5 │ 4.0 │ 0.8201944658940568 │
│ OH │ 3.421852731591449 │ 3.5 │ 4.0 │ 0.8283107681322551 │
│ GA │ 3.399796195652174 │ 3.5 │ 3.5 │ 0.7965101129423892 │
│ KY │ 2.0 │ 2.0 │ 2.0 │ NULL │
│ VA │ 2.0 │ 2.0 │ 2.0 │ NULL │
│ KS │ 2.0 │ 2.0 │ 2.0 │ NULL │
│ WY │ 1.5 │ 1.5 │ 1.5 │ NULL │
├─────────┴────────────────────┴──────────────┴────────────┴────────────────────┤
│ 16 rows 5 columns │
└───────────────────────────────────────────────────────────────────────────────┘con.sql("""
SELECT city, avg(stars) as Mean_stars, median(stars) as Median_stars, mode(stars) as Mode_stars, stddev_samp(stars) as Standard_deviation FROM restos
GROUP BY city
ORDER BY Mean_stars DESC
""")┌───────────────────┬────────────┬──────────────┬────────────┬────────────────────┐
│ city │ Mean_stars │ Median_stars │ Mode_stars │ Standard_deviation │
│ varchar │ double │ double │ double │ double │
├───────────────────┼────────────┼──────────────┼────────────┼────────────────────┤
│ Wekiva Springs │ 5.0 │ 5.0 │ 5.0 │ NULL │
│ columbus │ 5.0 │ 5.0 │ 5.0 │ NULL │
│ Jackson │ 5.0 │ 5.0 │ 5.0 │ NULL │
│ Winter park │ 5.0 │ 5.0 │ 5.0 │ NULL │
│ Brookwood │ 5.0 │ 5.0 │ 5.0 │ NULL │
│ Gotha │ 5.0 │ 5.0 │ 5.0 │ NULL │
│ St Johns │ 5.0 │ 5.0 │ 5.0 │ NULL │
│ portland │ 5.0 │ 5.0 │ 5.0 │ NULL │
│ Northeast Orlando │ 5.0 │ 5.0 │ 5.0 │ NULL │
│ Union Park │ 4.75 │ 4.75 │ 4.5 │ 0.3535533905932738 │
│ · │ · │ · │ · │ · │
│ · │ · │ · │ · │ · │
│ · │ · │ · │ · │ · │
│ Rockledge │ 2.0 │ 2.0 │ 2.0 │ NULL │
│ PORT COQUITLAM │ 1.5 │ 1.5 │ 1.5 │ NULL │
│ Southeast Orlando │ 1.5 │ 1.5 │ 1.5 │ NULL │
│ WINTER GARDEN │ 1.5 │ 1.5 │ 1.5 │ NULL │
│ Sheridan │ 1.5 │ 1.5 │ 1.5 │ NULL │
│ E.Point │ 1.5 │ 1.5 │ 1.5 │ NULL │
│ Candler-McAfee │ 1.5 │ 1.5 │ 1.5 │ NULL │
│ Englewood │ 1.5 │ 1.5 │ 1.5 │ NULL │
│ Clarkson │ 1.5 │ 1.5 │ 1.5 │ NULL │
│ Miami Beach │ 1.0 │ 1.0 │ 1.0 │ NULL │
├───────────────────┴────────────┴──────────────┴────────────┴────────────────────┤
│ 452 rows (20 shown) 5 columns │
└─────────────────────────────────────────────────────────────────────────────────┘con.sql("""
SELECT categories, avg(stars) as Mean_stars, median(stars) as Median_stars, mode(stars) as Mode_stars, stddev_samp(stars) as Standard_deviation FROM restos
GROUP BY categories
ORDER BY Mean_stars DESC
""")┌────────────────────────────────────────────────────────┬────────────┬──────────────┬────────────┬────────────────────┐
│ categories │ Mean_stars │ Median_stars │ Mode_stars │ Standard_deviation │
│ varchar │ double │ double │ double │ double │
├────────────────────────────────────────────────────────┼────────────┼──────────────┼────────────┼────────────────────┤
│ Desserts, French, Food, Restaurants, Creperies │ 5.0 │ 5.0 │ 5.0 │ NULL │
│ Coffee & Tea, Sandwiches, Restaurants, Food, Coffee … │ 5.0 │ 5.0 │ 5.0 │ NULL │
│ Falafel, Middle Eastern, Lebanese, Restaurants, Gree… │ 5.0 │ 5.0 │ 5.0 │ NULL │
│ Mexican, Tacos, Food, Restaurants, Food Trucks │ 5.0 │ 5.0 │ 5.0 │ NULL │
│ Middle Eastern, Arabian, Kebab, Mediterranean, Halal… │ 5.0 │ 5.0 │ 5.0 │ NULL │
│ Restaurants, Food, Korean, Food Trucks │ 5.0 │ 5.0 │ 5.0 │ NULL │
│ Middle Eastern, Food, Turkish, Restaurants │ 5.0 │ 5.0 │ 5.0 │ NULL │
│ Bars, Nightlife, Arts & Entertainment, American (Tra… │ 5.0 │ 5.0 │ 5.0 │ NULL │
│ Food Trucks, Street Vendors, Breakfast & Brunch, Mex… │ 5.0 │ 5.0 │ 5.0 │ NULL │
│ Restaurants, Delicatessen, Delis, Food │ 5.0 │ 5.0 │ 5.0 │ NULL │
│ · │ · │ · │ · │ · │
│ · │ · │ · │ · │ · │
│ · │ · │ · │ · │ · │
│ American (New), Hot Dogs, Vegan, Burgers, American (… │ 4.0 │ 4.0 │ 4.0 │ NULL │
│ Food Trucks, Seafood, Food, Seafood Markets, Restaur… │ 4.0 │ 4.0 │ 4.0 │ NULL │
│ Poke, Food, Salad, Restaurants, Hawaiian │ 4.0 │ 4.0 │ 4.0 │ NULL │
│ Korean, Food Trucks, Street Vendors, American (New),… │ 4.0 │ 4.0 │ 4.0 │ NULL │
│ Soup, Restaurants, Sandwiches, American (New) │ 4.0 │ 4.0 │ 4.0 │ NULL │
│ Coffee & Tea, Breakfast & Brunch, Restaurants, Food,… │ 4.0 │ 4.0 │ 4.0 │ NULL │
│ Breakfast & Brunch, Restaurants, Coffee & Tea, Food,… │ 4.0 │ 4.0 │ 4.0 │ NULL │
│ Food, Thai, Bars, Nightlife, Taiwanese, Restaurants,… │ 4.0 │ 4.0 │ 4.0 │ NULL │
│ Pubs, Bars, American (Traditional), Nightlife, Tapas… │ 4.0 │ 4.0 │ 4.0 │ NULL │
│ Food, Cafes, Coffee & Tea, Sandwiches, Restaurants │ 4.0 │ 4.0 │ 4.0 │ NULL │
├────────────────────────────────────────────────────────┴────────────┴──────────────┴────────────┴────────────────────┤
│ ? rows (>9999 rows, 20 shown) 5 columns │
└──────────────────────────────────────────────────────────────────────────────────────────────────────────────────────┘how many restaurants provide wifi
con.sql("""
    SELECT DISTINCT "attributes.WiFi" FROM restos
""").df()| attributes.WiFi | |
|---|---|
| 0 | u'no' |
| 1 | u'paid' |
| 2 | 'paid' |
| 3 | None |
| 4 | 'no' |
| 5 | u'free' |
| 6 | 'free' |
| 7 | None |
cleaning the data
df_temp = con.sql("""
    SELECT "attributes.WiFi" AS wifi, count("attributes.WiFi") AS count FROM restos
    GROUP BY wifi
""").df()
df_temp| wifi | count | |
|---|---|---|
| 0 | 'free' | 5496 |
| 1 | u'paid' | 184 |
| 2 | 'no' | 4394 |
| 3 | None | 29 |
| 4 | None | 0 |
| 5 | u'free' | 14994 |
| 6 | u'no' | 11706 |
| 7 | 'paid' | 81 |
df_new = pd.DataFrame({
    "wifi": [
        "None",
        "Free",
        "No",
        "Paid"
    ],
    "count": [
        (df_temp["count"][0] + df_temp["count"][7]),
        (df_temp["count"][1] + df_temp["count"][3]),
        (df_temp["count"][2] + df_temp["count"][5]),
        (df_temp["count"][4] + df_temp["count"][6])
    ]
})
df_new| wifi | count | |
|---|---|---|
| 0 | None | 5577 |
| 1 | Free | 213 |
| 2 | No | 19388 |
| 3 | Paid | 11706 |
finding the usefull votes received by reviews grouped by star ratings
df_temp = con.sql("""
    SELECT stars, sum(useful) as sum_useful, avg(useful) as avg_useful, max(useful) AS max_useful FROM resto_reviews
    GROUP BY stars
    ORDER BY stars ASC
""").df()
df_temp| stars | sum_useful | avg_useful | max_useful | |
|---|---|---|---|---|
| 0 | 1 | 239163.0 | 1.256445 | 146 |
| 1 | 2 | 184718.0 | 1.192214 | 260 |
| 2 | 3 | 216230.0 | 1.000694 | 177 |
| 3 | 4 | 454666.0 | 1.036895 | 411 |
| 4 | 5 | 556257.0 | 0.825011 | 223 |
sns.set_palette("husl")
sns.set_context("talk")
sns.catplot(data = df_temp, x = "stars", y = "sum_useful", kind = "bar")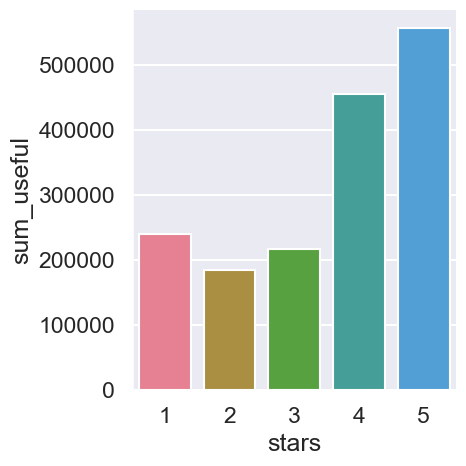
sns.set_palette("husl")
sns.catplot(data = df_temp, x = "stars", y = "avg_useful", kind = "bar")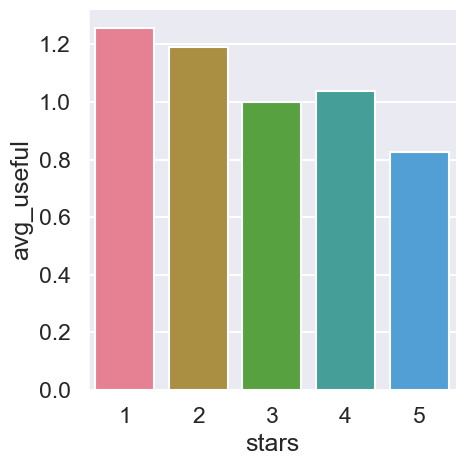
df_table = con.sql("""
WITH BusinessCategories AS (
    SELECT UNNEST(STRING_TO_ARRAY(categories, ',')) AS category
    FROM restos
    WHERE stars >= 4
)
SELECT category, COUNT(*) AS count
FROM BusinessCategories
GROUP BY category
ORDER BY count DESC;

""").df()
df_table['category'] = df_table['category'].str.strip()
df_grouped = df_table.groupby('category', as_index=False).sum()
df_sorted = df_grouped.sort_values(by='count', ascending=False)
df_top20 = df_sorted.head(20)
df_sorted | category | count | |
|---|---|---|
| 470 | Restaurants | 21029 |
| 228 | Food | 8735 |
| 390 | Nightlife | 3570 |
| 53 | Bars | 3428 |
| 477 | Sandwiches | 3158 |
| ... | ... | ... |
| 452 | Psychics | 1 |
| 453 | Pub Food | 1 |
| 216 | Fences & Gates | 1 |
| 455 | Public Relations | 1 |
| 96 | Cabinetry | 1 |
617 rows × 2 columns
plt.figure(figsize=(12, 6))  # Adjust the width (12) and height (6) as needed
sns.catplot(data = df_top20, x = "category", y = "count", palette='viridis',kind = "bar",height= 8, aspect=2.5)
# Step 3: Create a histogram plot using seaborn

# Step 4: Rotate x-axis labels if needed (optional)
plt.xticks(rotation=45)  # Rotate labels if they overlap, adjust the angle as needed

# Step 5: Customize the plot
plt.title('Histogram of the First 20 Rows')
plt.xlabel('Value')
plt.ylabel('Frequency')

# Step 6: Add padding around the plot
plt.tight_layout()

# Step 7: Show the plot
plt.show()
<Figure size 1200x600 with 0 Axes>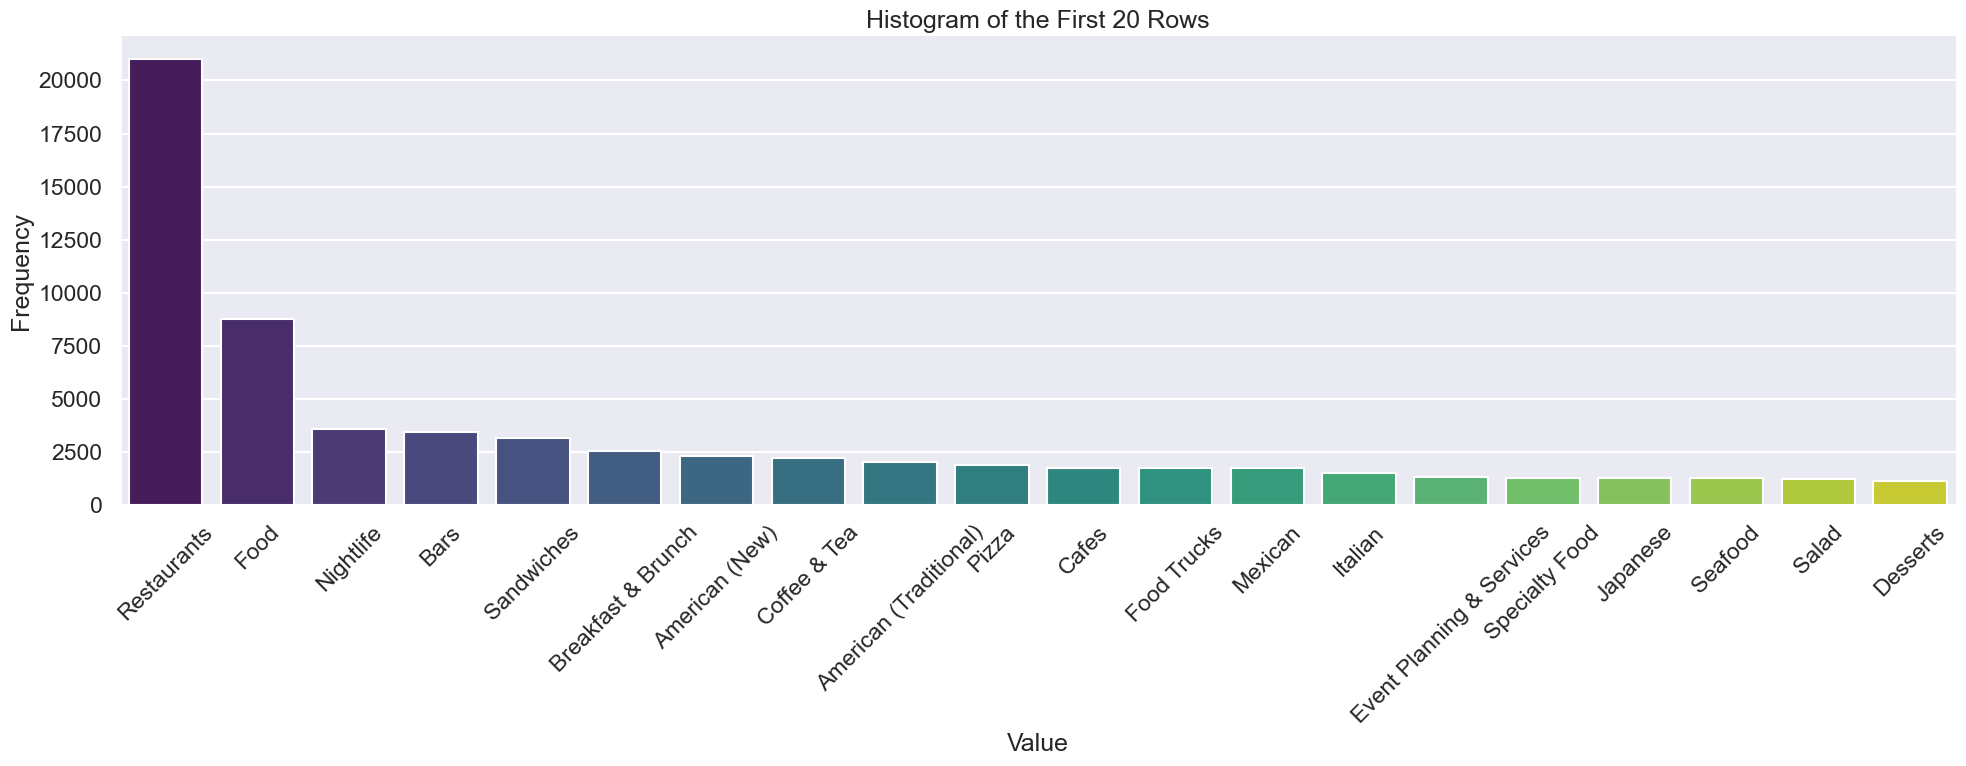
from this we can see resaurants with higher stars are categorised mainly in restaurant, food, nightlife, bar so a restaurant cum bar which has great food and nightlife seems a good option
We’ll try to find if there are correalation between ranks and some other variables using Spearman rank correalation.
def spear_correal(df,columnName):
    df.fillna('None',inplace = True)
    df.isnull().sum().sum()
    df1  = df[df[columnName].isin(['True', 'False'])]
    df1 = df1.copy()
    df1[columnName] = df1[columnName].apply(lambda x: str(x))
    df1[columnName] = df_temp[columnName].map({'True': 1, 'False': 0})

    # Calculate Spearman correlation
    correlation, p_value = spearmanr(df1['stars'], df1[columnName])

    print(f"Spearman Correlation for Stars and {columnName}: {correlation}")
    print(f"P-Value: {p_value}")
from scipy.stats import spearmanr
df_temp = con.sql("""
SELECT stars, "attributes.OutdoorSeating" AS outdoorSetting FROM restos
ORDER BY stars ASC
""").df()
spear_correal(df_temp,'outdoorSetting')Spearman Correlation for Stars and outdoorSetting: 0.16219573052211875
P-Value: 1.1884858999560221e-236df_temp = con.sql("""
SELECT stars, "attributes.GoodForKids" AS GoodForKids FROM restos
ORDER BY stars ASC
""").df()
spear_correal(df_temp,'GoodForKids')Spearman Correlation for Stars and GoodForKids: 0.0066133919328259915
P-Value: 0.18340820709810265df_temp = con.sql("""
SELECT stars, "attributes.RestaurantsTableService" AS RestaurantsTableService FROM restos
ORDER BY stars ASC
""").df()
spear_correal(df_temp,'RestaurantsTableService')Spearman Correlation for Stars and RestaurantsTableService: -0.0994801035971547
P-Value: 6.084927694546583e-42df_temp = con.sql("""
SELECT stars, "attributes.RestaurantsGoodForGroups" AS RestaurantsGoodForGroups FROM restos
ORDER BY stars ASC
""").df()
spear_correal(df_temp,'RestaurantsGoodForGroups')Spearman Correlation for Stars and RestaurantsGoodForGroups: -0.0026774151362220916
P-Value: 0.5880048903696755df_temp = con.sql("""
SELECT stars, "attributes.Wifi" AS Wifi FROM restos
ORDER BY stars ASC
""").df()
def clean_value(value):
if value is None or value.lower() == 'none':
return None
elif 'free' in value.lower():
return 'True'
elif 'no' in value.lower():
return 'False'
elif 'paid' in value.lower():
return 'paid'
else:
return value
# Apply the function to the column
df_temp['Wifi'] = df_temp['Wifi'].apply(clean_value)
# Display the cleaned DataFrame
spear_correal(df_temp,'Wifi')Spearman Correlation for Stars and Wifi: 0.03168203012314857
P-Value: 1.3476091835891137e-09df_temp = con.sql("""
SELECT stars, "attributes.BusinessAcceptsCreditCards" AS BusinessAcceptsCreditCards FROM restos
ORDER BY stars ASC
""").df()
spear_correal(df_temp,'BusinessAcceptsCreditCards')Spearman Correlation for Stars and BusinessAcceptsCreditCards: -0.07706876996276704
P-Value: 3.59912693693516e-53df_temp = con.sql("""
SELECT
user_friends.int_user_id,
user_friends.num_friends,
users.useful
FROM
user_friends
JOIN
users
ON
users.int_user_id = user_friends.int_user_id;
""").df()
df_temp
plt.scatter(df_temp['num_friends'], df_temp['useful'])
plt.xlabel('Number of Friends')
plt.ylabel('Useful')
plt.title('Scatter Plot of Number of Friends vs. Useful')Text(0.5, 1.0, 'Scatter Plot of Number of Friends vs. Useful')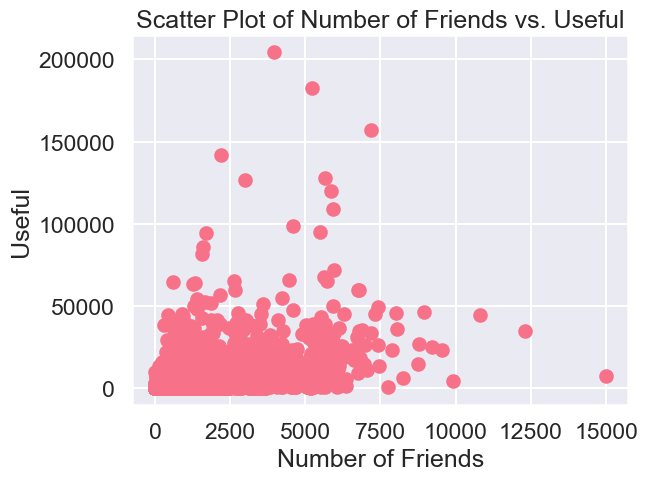
<h1> Pie Chart of Stars
</h1></div>
df_temp = con.sql("""
SELECT stars, count(stars) AS starsCount FROM resto_reviews
GROUP BY stars
ORDER BY stars ASC
""").df()
df_temp
colors = sns.color_palette('husl')
df_temp.plot.pie(y='starsCount', labels=df_temp['stars'], autopct='%1.1f%%', figsize=(8, 8), colors = colors)
# Set title
plt.title('Pie Chart of Stars')
# Show the plot
plt.show()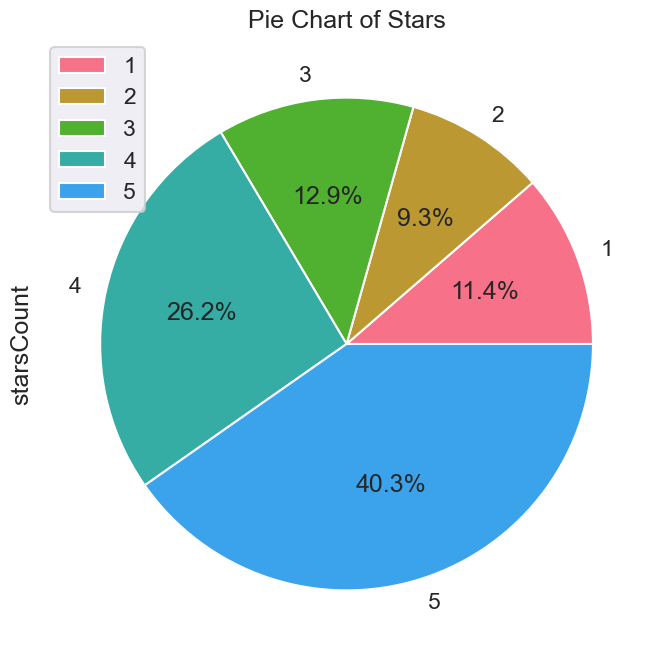
<h1>Hypothesis Testing
</h1></div>
df_restos = con.sql("""
SELECT int_business_id,name,address,city,state,postal_code,stars,review_count,is_open,"attributes.RestaurantsTableService","attributes.BikeParking","attributes.BusinessAcceptsCreditCards","attributes.RestaurantsReservations","attributes.OutdoorSeating","attributes.RestaurantsTakeOut","attributes.GoodForKids","attributes.Open24Hours" FROM restos;
""").df()data_attributes = []
arr=[]
t_stat=[]
p_val=[]
sign=[]
significant_attributes=[]
for i in df_restos.columns:
if i.startswith("attributes"):
print("attribute Name: {}".format(i) )
print("attribute unique values : {}".format(df_restos[i].unique()))
data_attributes.append(i)
print(data_attributes)
rows_count = len(df_restos)
def hypothesis_test(grp1, grp2, attribute):
group1 = grp1 # Ratings for group 1
group2 = grp2
t_statistic, p_value = spst.ttest_ind(group1, group2, alternative='two-sided')
arr.append(attribute)
t_stat.append(t_statistic)
p_val.append(p_value)
bool=True
if p_value<0.1:
bool=True
significant_attributes.append(attribute)
else:
bool=False
sign.append(bool)
print(f"T-Statistic: {t_statistic}")
print(f"P-Value: {p_value}")
for attribute in data_attributes:
grp1=[]
grp2=[]
for index in range(rows_count):
attribute_value = df_restos.loc[index,attribute]
if (attribute_value == "True" or attribute_value == True):
grp1.append(df_restos.loc[index,"stars"])
elif(attribute_value == "False" or attribute_value == False):
grp2.append(df_restos.loc[index,"stars"])
hypothesis_test(grp1,grp2,attribute)
df_results= pd.DataFrame({'attributes':arr, 't-stat':t_stat, 'p-value':p_val, 'Is-significant(p<alpha)':sign})
df_resultsattribute Name: attributes.RestaurantsTableService
attribute unique values : ['True' 'Unknown' 'False' 'None']
attribute Name: attributes.BikeParking
attribute unique values : ['True' 'False' 'Unknown' 'None']
attribute Name: attributes.BusinessAcceptsCreditCards
attribute unique values : ['True' 'Unknown' 'False' 'None']
attribute Name: attributes.RestaurantsReservations
attribute unique values : ['False' 'True' 'Unknown' 'None']
attribute Name: attributes.OutdoorSeating
attribute unique values : ['True' 'False' 'Unknown' 'None']
attribute Name: attributes.RestaurantsTakeOut
attribute unique values : ['True' 'Unknown' 'None' 'False']
attribute Name: attributes.GoodForKids
attribute unique values : ['Unknown' 'True' 'False' 'None']
attribute Name: attributes.Open24Hours
attribute unique values : ['Unknown' False True]
['attributes.RestaurantsTableService', 'attributes.BikeParking', 'attributes.BusinessAcceptsCreditCards', 'attributes.RestaurantsReservations', 'attributes.OutdoorSeating', 'attributes.RestaurantsTakeOut', 'attributes.GoodForKids', 'attributes.Open24Hours']
T-Statistic: -7.372668695798382
P-Value: 1.742929168567777e-13
T-Statistic: 27.617727216768504
P-Value: 4.8420795506096176e-166
T-Statistic: -14.802489839883231
P-Value: 1.9152766670078407e-49
T-Statistic: 14.247260843911603
P-Value: 5.9719676544221295e-46
T-Statistic: 34.46783403696211
P-Value: 1.2772571268991985e-256
T-Statistic: -2.9917912366476616
P-Value: 0.0027749658574526786
T-Statistic: 1.39949765413476
P-Value: 0.16167146721429418
T-Statistic: 0.0
P-Value: 1.0| attributes | t-stat | p-value | Is-significant(p<alpha) | |
|---|---|---|---|---|
| 0 | attributes.RestaurantsTableService | -7.372669 | 1.742929e-13 | True |
| 1 | attributes.BikeParking | 27.617727 | 4.842080e-166 | True |
| 2 | attributes.BusinessAcceptsCreditCards | -14.802490 | 1.915277e-49 | True |
| 3 | attributes.RestaurantsReservations | 14.247261 | 5.971968e-46 | True |
| 4 | attributes.OutdoorSeating | 34.467834 | 1.277257e-256 | True |
| 5 | attributes.RestaurantsTakeOut | -2.991791 | 2.774966e-03 | True |
| 6 | attributes.GoodForKids | 1.399498 | 1.616715e-01 | False |
| 7 | attributes.Open24Hours | 0.000000 | 1.000000e+00 | False |
from scipy.stats import f_oneway
grouped_by_state = [group['stars'].values for name, group in df_restos.groupby('state')]
f_statistic_state, p_value_state = f_oneway(*grouped_by_state)print(f"State-wide Analysis: F-statistic = {f_statistic_state}, p-value = {p_value_state}")
if p_value_state < 0.05:
print("Reject the null hypothesis: There is a significant difference in average reviews across states.")
else:
print("Fail to reject the null hypothesis: No significant difference in average reviews across states.")State-wide Analysis: F-statistic = 76.2248728686078, p-value = 1.4925442502613572e-231
Reject the null hypothesis: There is a significant difference in average reviews across states.<h1>ANOVA Test
</h1></div>Null Hypothesis (H0): The mean restaurant ratings are the same across different States.
Alternative Hypothesis (H1): The mean restaurant ratings differ across States.
df_state = con.sql("""
    SELECT state, stars as stars FROM restos
    ORDER BY stars DESC
""").df()
df_state| state | stars | |
|---|---|---|
| 0 | TX | 5.0 |
| 1 | OR | 5.0 |
| 2 | FL | 5.0 |
| 3 | OR | 5.0 |
| 4 | OH | 5.0 |
| ... | ... | ... |
| 48795 | FL | 1.0 |
| 48796 | OR | 1.0 |
| 48797 | OR | 1.0 |
| 48798 | GA | 1.0 |
| 48799 | OH | 1.0 |
48800 rows × 2 columns
from statsmodels.formula.api import ols
model = ols('stars ~ C(state)', data=df_state).fit()

# Perform ANOVA
anova_table = sm.stats.anova_lm(model, typ=2)

# Print the results
print(anova_table)
sum_sq df F PR(>F)
C(state) 669.225082 15.0 76.224873 1.492544e-231
Residual 28553.651142 48784.0 NaN NaNHere we can see, p value is very much lesser than alpha which is 0.05, hence we rejet the null hypothesis, and conclude that The mean restaurant ratings differ across states
Null Hypothesis (H0): The mean restaurant ratings are the same across different Cities.
Alternative Hypothesis (H1): The mean restaurant ratings differ across Cities.
df_city = con.sql("""
    SELECT city, stars FROM restos
""").df()
df_city| city | stars | |
|---|---|---|
| 0 | Boulder | 4.0 |
| 1 | Portland | 4.0 |
| 2 | Vancouver | 3.5 |
| 3 | Columbus | 4.5 |
| 4 | Peabody | 4.0 |
| ... | ... | ... |
| 48795 | Tigard | 2.0 |
| 48796 | Bee Cave | 3.0 |
| 48797 | Atlanta | 3.0 |
| 48798 | Portland | 4.0 |
| 48799 | Altamonte Springs | 4.5 |
48800 rows × 2 columns
model = ols('stars ~ C(city)', data=df_city).fit()

# Perform ANOVA
anova_table = sm.stats.anova_lm(model, typ=2)

# Print the results
print(anova_table)
sum_sq df F PR(>F)
C(city) 1570.357546 451.0 6.087876 5.288212e-313
Residual 27652.518679 48348.0 NaN NaNHere we can see, p value is very much lesser than alpha which is 0.05, hence we rejet the null hypothesis, and conclude that The mean restaurant ratings differ across Cities
<h1> Confidence Interval</h1></div>attribute_list = []
lower_interval_list = []
upper_interval_list = []
def get_praportionality(df,attribute):
n = len(df)
#using alpha as 0.05
z = 1.96
true_count = len(df[(df[attribute] == 'True') | (df[attribute] == True)])
p_bar = true_count/n
se = np.sqrt(p_bar * (1 - p_bar) / n)
moe = z*se
confidence_interval = (p_bar - moe,p_bar + moe)
return confidence_interval
for attribute in significant_attributes:
confidence_interval = get_praportionality(df_restos,attribute)
attribute_list.append(attribute)
lower_interval_list.append(confidence_interval[0])
upper_interval_list.append(confidence_interval[1])
df_results= pd.DataFrame({'attributes':attribute_list, 'lower_interval':lower_interval_list, 'upper_interval':upper_interval_list})
df_results| attributes | lower_interval | upper_interval | |
|---|---|---|---|
| 0 | attributes.RestaurantsTableService | 0.218280 | 0.225654 |
| 1 | attributes.BikeParking | 0.534245 | 0.543091 |
| 2 | attributes.BusinessAcceptsCreditCards | 0.783974 | 0.791231 |
| 3 | attributes.RestaurantsReservations | 0.288607 | 0.296680 |
| 4 | attributes.OutdoorSeating | 0.402568 | 0.411285 |
| 5 | attributes.RestaurantsTakeOut | 0.870948 | 0.876839 |
<h1> Regression</h1></div>def regressionTest(df):
columns_to_exclude = ['stars', 'review_count']
binary_columns = [col for col in df.columns if col not in columns_to_exclude]
mask = df[binary_columns].apply(lambda x: all(val in ['True', 'False'] for val in x), axis=1)
filtered_df = df[mask]
for col in binary_columns:
filtered_df.loc[:, col] = filtered_df[col].replace({'True': 1, 'False': 0})
for col in filtered_df.columns:
if filtered_df[col].isin(['0', '1',1,0]).all():
filtered_df[col] = filtered_df[col].astype(int)
indipendant_column = [col for col in df.columns if col != 'stars']
X = filtered_df[indipendant_column] # Quantitative and binary predictors
y = filtered_df['stars'] # Quantitative outcome
print(filtered_df.dtypes)
# Add a constant to the model (intercept)
X = sm.add_constant(X)
# Fit the multiple linear regression model
model = sm.OLS(y, X).fit()
# Print the summary of the regression
print(model.summary())df_temp = con.sql("""
SELECT stars, review_count, "attributes.BusinessAcceptsCreditCards" AS BusinessAcceptsCreditCards, "attributes.OutdoorSeating" AS OutdoorSeating,"attributes.BikeParking" AS BikeParking, "attributes.RestaurantsReservations" AS RestaurantsReservations, "attributes.RestaurantsTakeOut" AS RestaurantsTakeOut
FROM restos
ORDER BY stars ASC
""").df()
regressionTest(df_temp)stars float64
review_count int64
BusinessAcceptsCreditCards int32
OutdoorSeating int32
BikeParking int32
RestaurantsReservations int32
RestaurantsTakeOut int32
dtype: object
OLS Regression Results
==============================================================================
Dep. Variable: stars R-squared: 0.075
Model: OLS Adj. R-squared: 0.075
Method: Least Squares F-statistic: 338.4
Date: Sat, 31 Aug 2024 Prob (F-statistic): 0.00
Time: 20:20:39 Log-Likelihood: -26763.
No. Observations: 25046 AIC: 5.354e+04
Df Residuals: 25039 BIC: 5.360e+04
Df Model: 6
Covariance Type: nonrobust
==============================================================================================
coef std err t P>|t| [0.025 0.975]
----------------------------------------------------------------------------------------------
const 3.6810 0.037 100.705 0.000 3.609 3.753
review_count 0.0004 2.01e-05 18.138 0.000 0.000 0.000
BusinessAcceptsCreditCards -0.4209 0.031 -13.688 0.000 -0.481 -0.361
OutdoorSeating 0.1991 0.009 21.609 0.000 0.181 0.217
BikeParking 0.2205 0.011 20.221 0.000 0.199 0.242
RestaurantsReservations 0.1030 0.010 10.463 0.000 0.084 0.122
RestaurantsTakeOut -0.0953 0.022 -4.374 0.000 -0.138 -0.053
==============================================================================
Omnibus: 710.077 Durbin-Watson: 0.149
Prob(Omnibus): 0.000 Jarque-Bera (JB): 771.235
Skew: -0.428 Prob(JB): 3.38e-168
Kurtosis: 3.084 Cond. No. 2.77e+03
==============================================================================
Notes:
[1] Standard Errors assume that the covariance matrix of the errors is correctly specified.
[2] The condition number is large, 2.77e+03. This might indicate that there are
strong multicollinearity or other numerical problems.